# AMS (Ambari Metrics Service) Datasource Plugin for Grafana
Use **ambari-metrics** to visualize metrics exposed via AMS in Grafana.
### If you already have Ambari Metrics UI as a part of your AMS Install, [go here](#createdash) to get started
**ToC**
- [Install Grafana](#installg)
- [Install Datasource Plugin](#installam)
- [Access Grafana](#accessgraf)
- [Add Datasource to Grafana](#addds)
- [Test Datasource](#testds)
- [Create Dashboard](#createdash)
- [Add a Graph](#addgraph)
- [Save Dashboard](#savedash)
- [Time Ranges](#timerange)
- [Edit Panel/Graph](#editpanel)
- [Templated Dashboards](#templating)
- [Multi Host Templated Dashboards](#multi-templating)
----------
----------
### Install Grafana
You can install Grafana on any host. It does not need to be co-located with Ambari Metrics Collector. The only requirement is that it has network access to Ambari Metrics Collector.
**Install on CentOS/Red Hat:**
```
sudo yum install https://grafanarel.s3.amazonaws.com/builds/grafana-2.6.0-1.x86_64.rpm
```
**Install on Ubuntu/Debian:**
```
wget https://grafanarel.s3.amazonaws.com/builds/grafana_2.6.0_amd64.deb
sudo apt-get install -y adduser libfontconfig
sudo dpkg -i grafana_2.6.0_amd64.deb
```
**Install on SUSE/SLES:**
```
sudo rpm -i --nodeps grafana-2.6.0-1.x86_64.rpm
```
### Deploy ambari-metrics
**On your Grafana Server**
```
cp -R ambari/ambari-metrics/ambari-metrics-grafana/ambari-metrics /usr/share/grafana/public/app/plugins/datasource
```
### Start Grafana
```
sudo service grafana-server start
```
### Access Grafana
```
http://GRAFANA_HOST:3000
```
---
## Add Ambari Metrics Datasource in Grafana UI
**Add a Datasource**
> - Click on "Datasources"
> - Click on "Add New" at the top

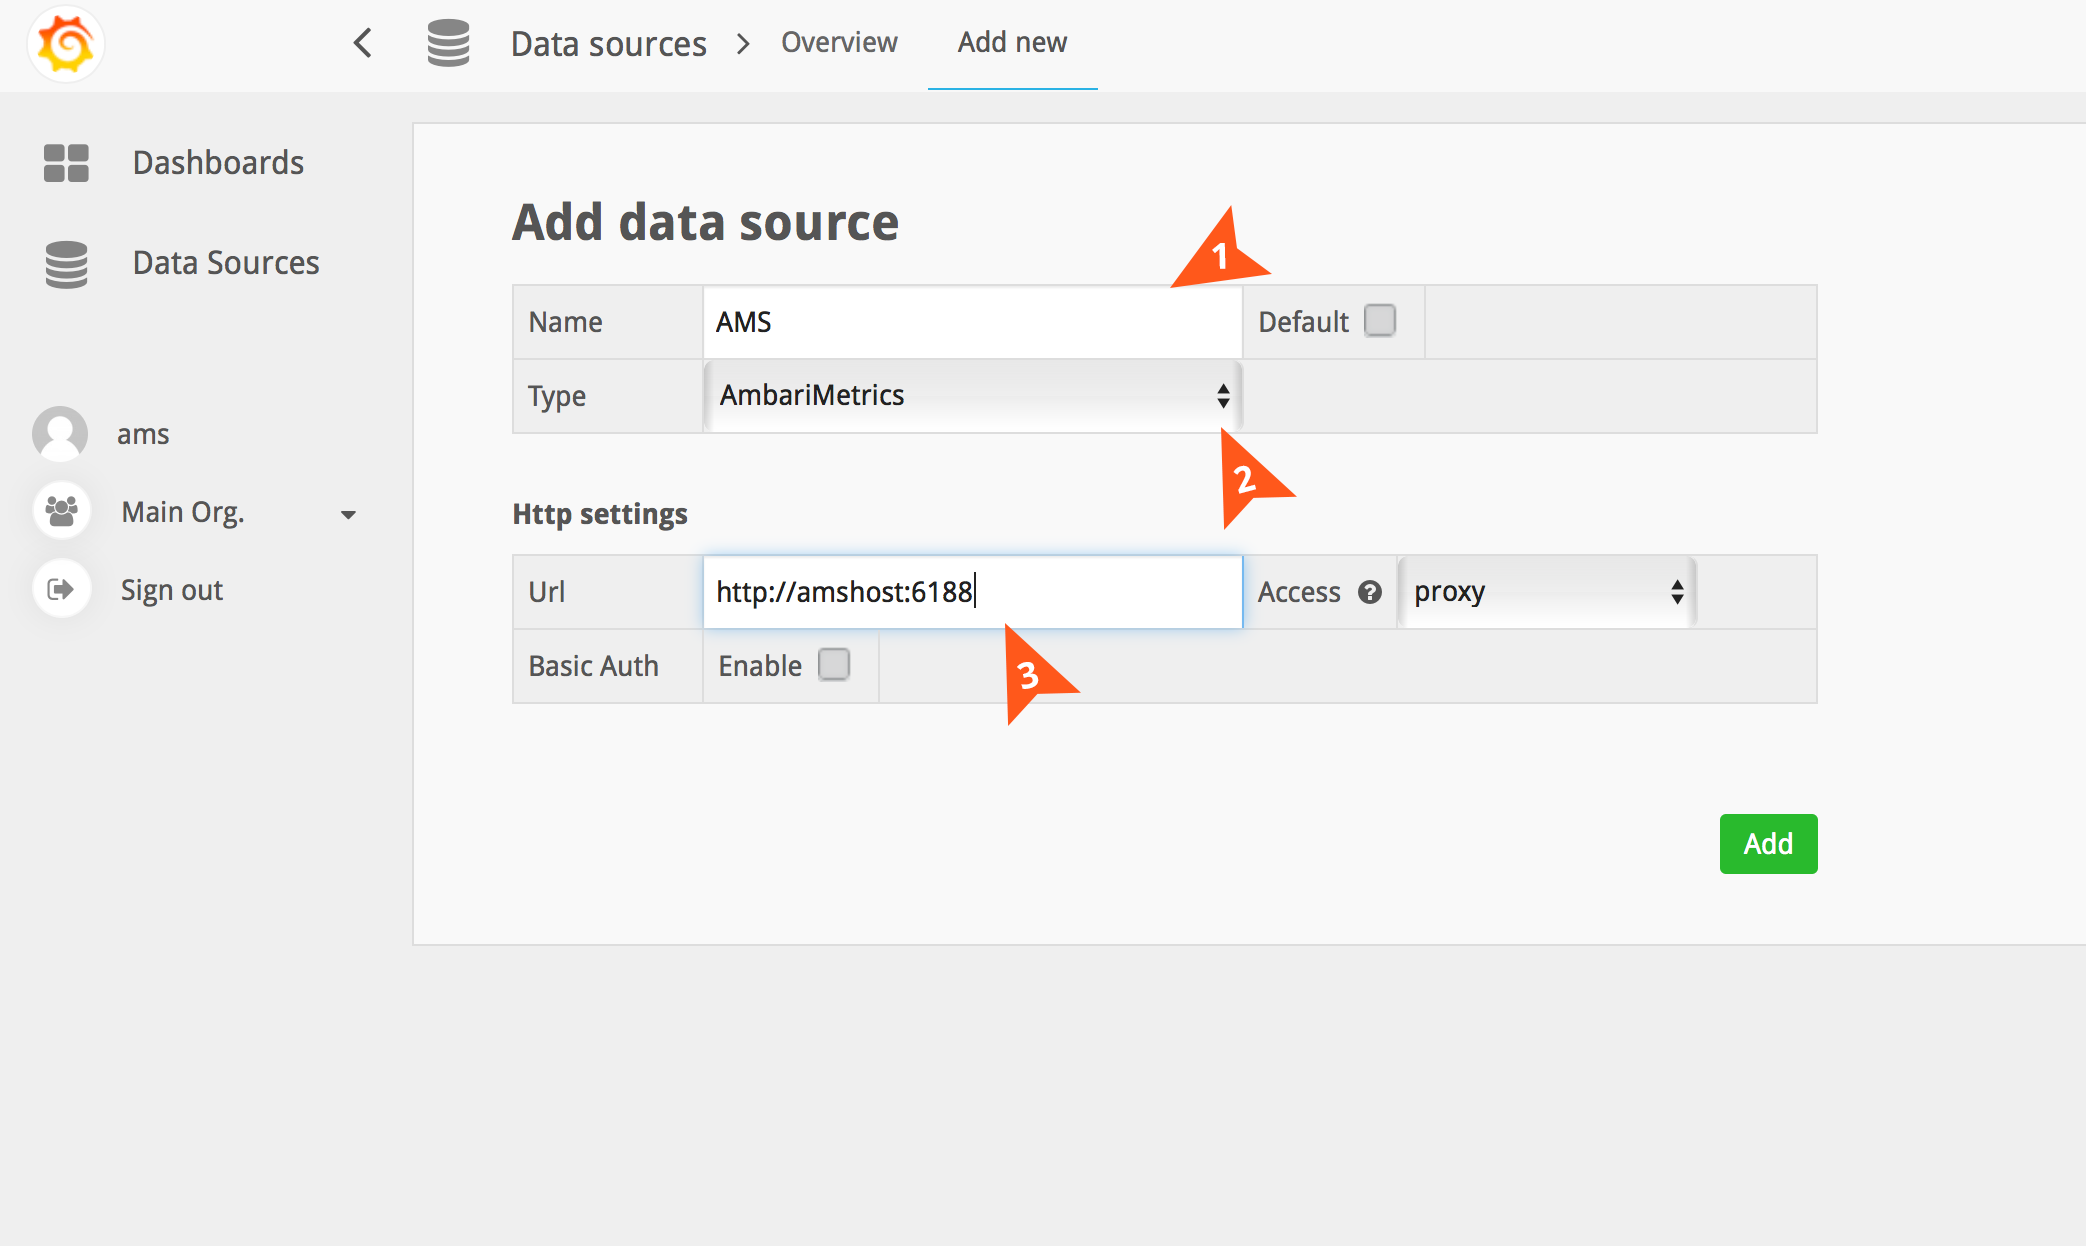
**Add a Datasource (continued)**
> 1. Name of your Datasource
> 2. Type = AmbariMetrics
> 3. Host+Port of your AMS installation. (usually host:6188)
> - No trailing slashes
> - Nothing else needs to be changed
> - Click on Save.
**Test your Datasource**
> To make sure it's all working, click on **Test Connection** and you should see a message that says "Data source is working".

---
## Creating a Dashboard
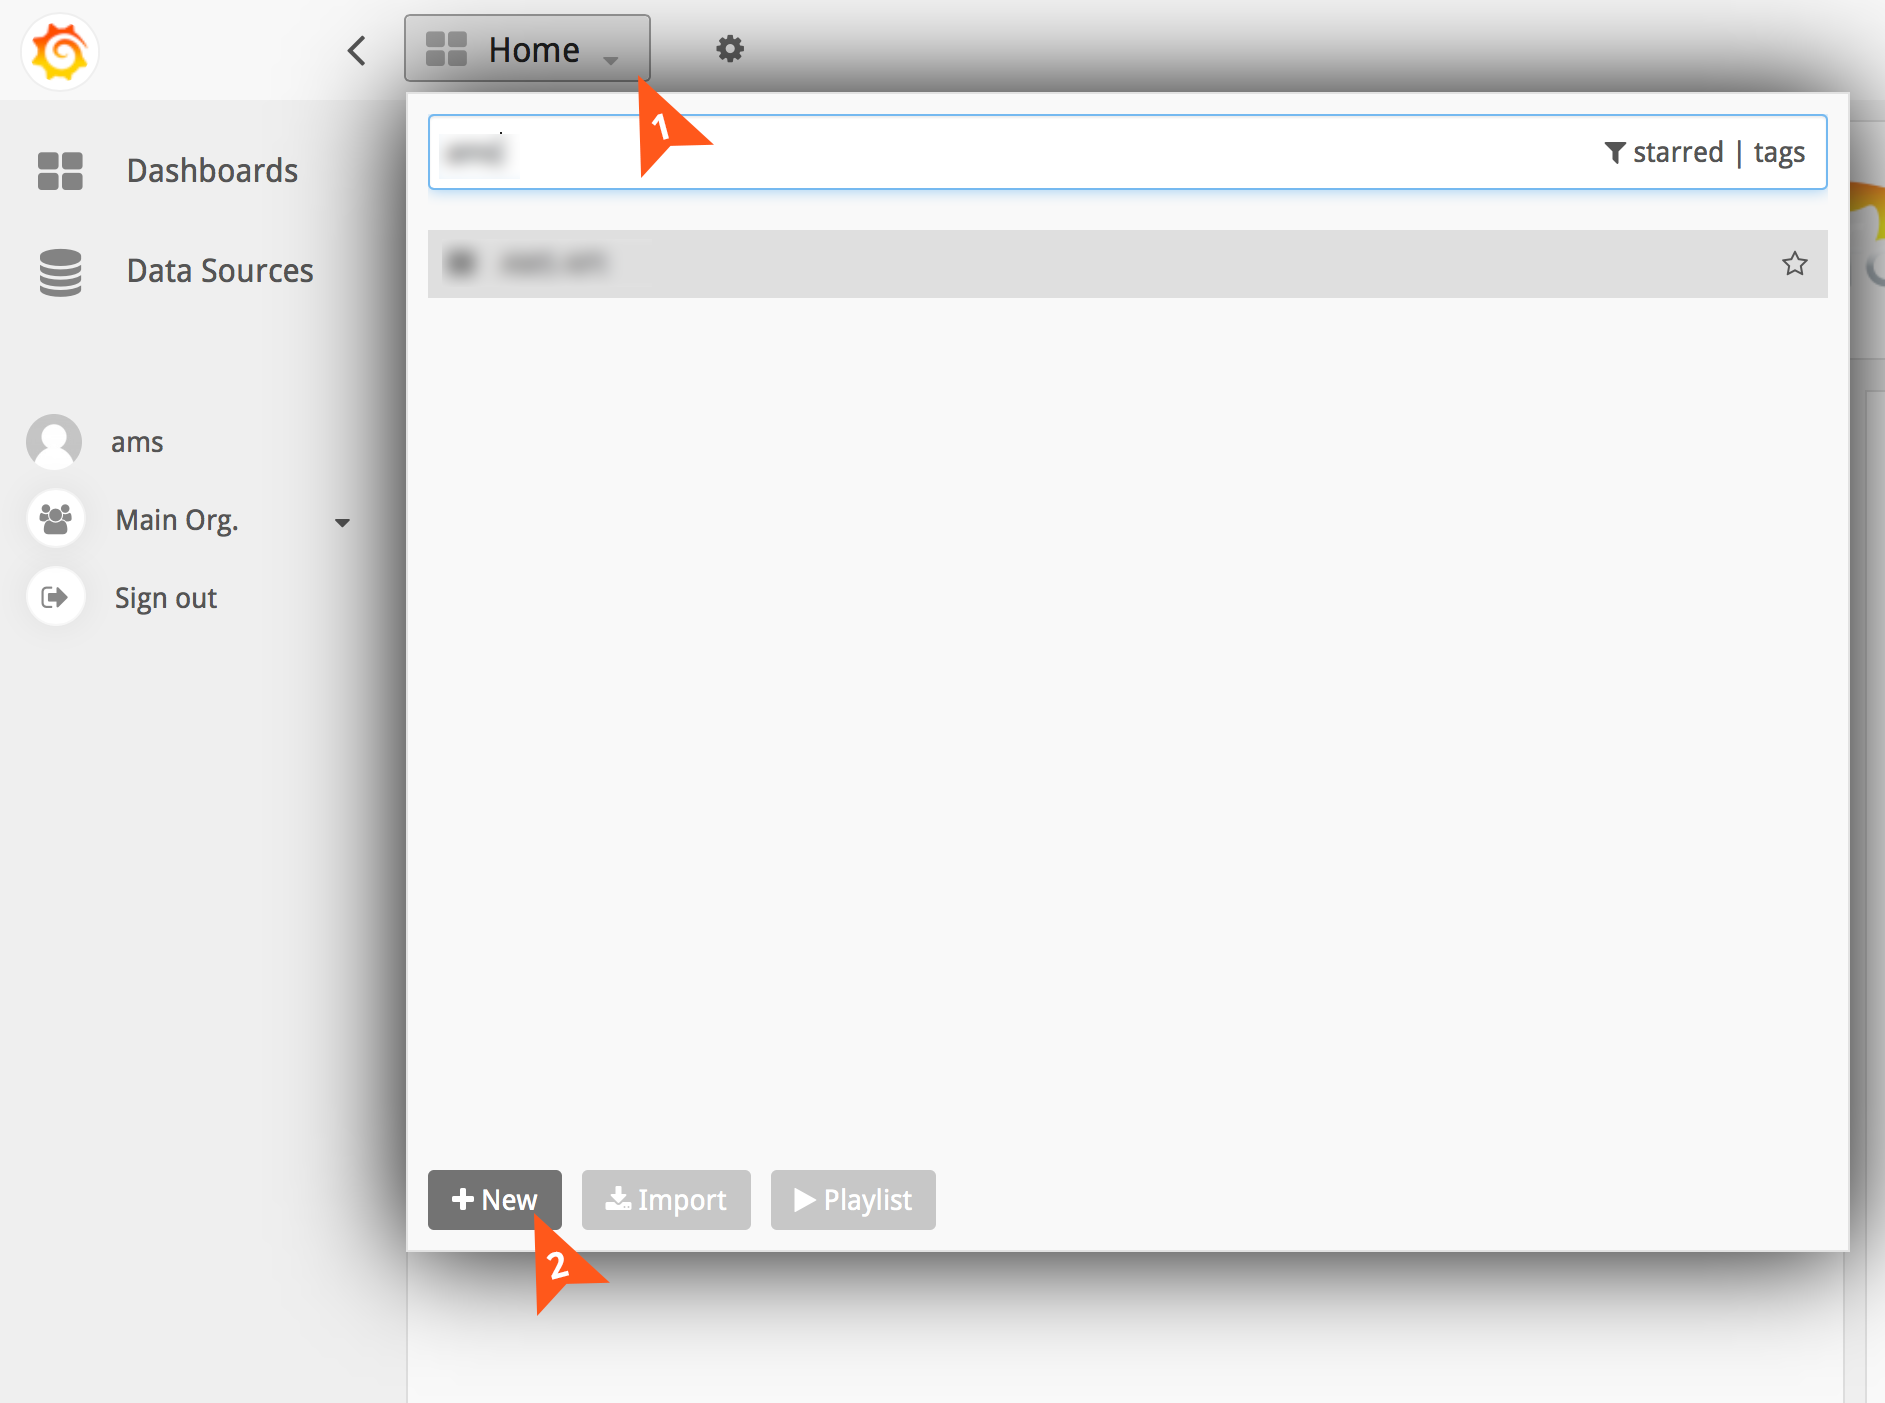
**To create a dashboard**
> - Click on Dashboards on the left
> - Click on "Home"
> - Click on New at the bottom of the dropdown
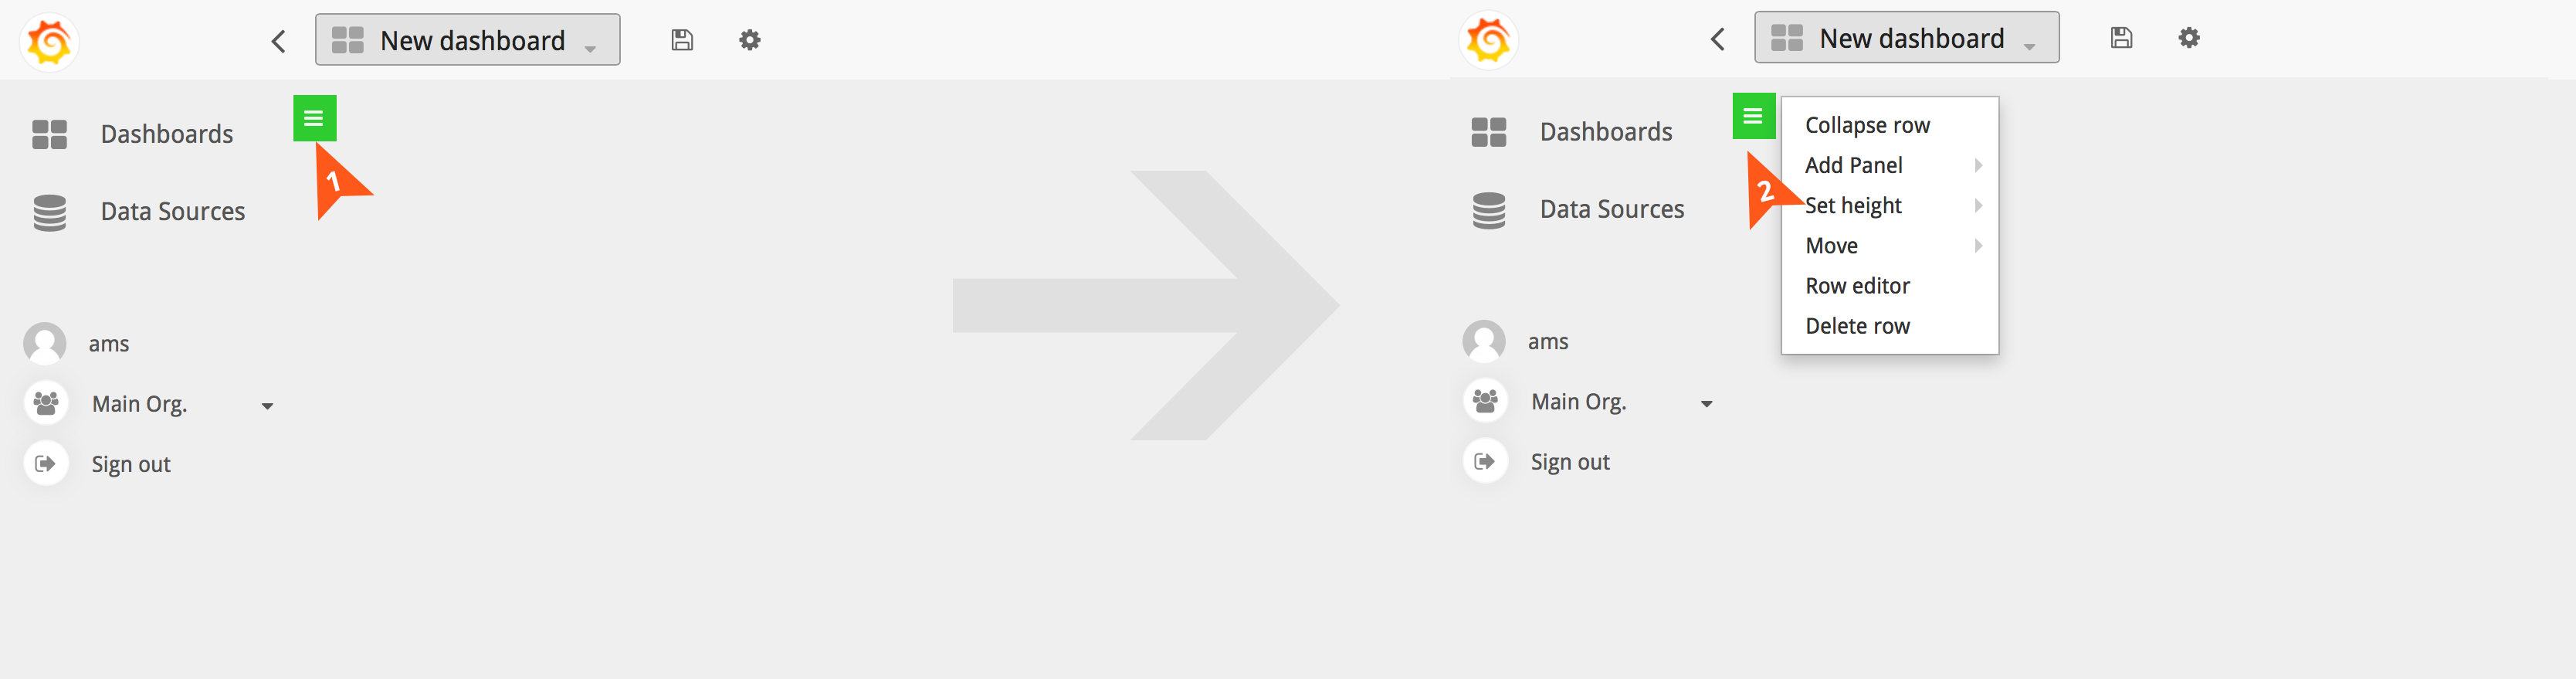
**To add a panel to your newly created dashboard**
> - Click on the green button on the left(see image below)
> - This will expand a flyout menu that will allow you to add a panel
> - Choose Graph / Table / Single Stat

---
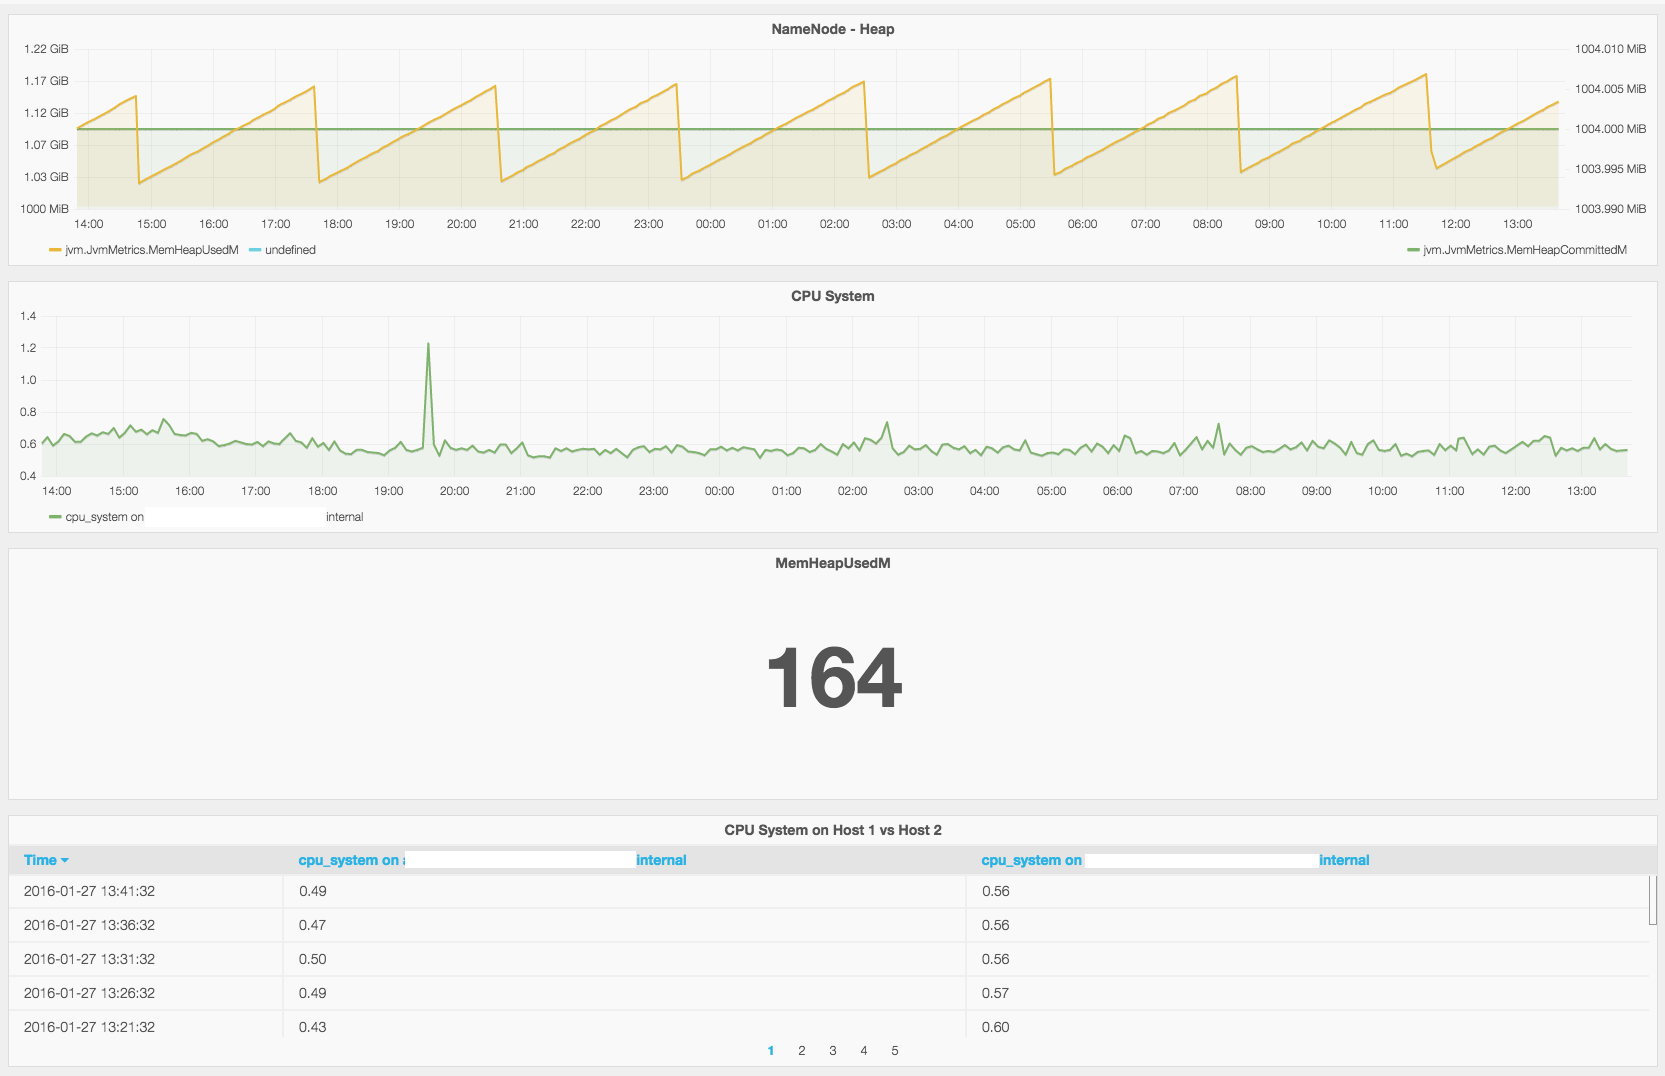
**To add a Graph**
> - Choose the Datasource you created earlier
> - Once you've chosen the datasource, you should see the query editor show you some options

> - Choose the component you wish to see metrics for

> - Based on the component chosen, you should now see a list of metrics for it
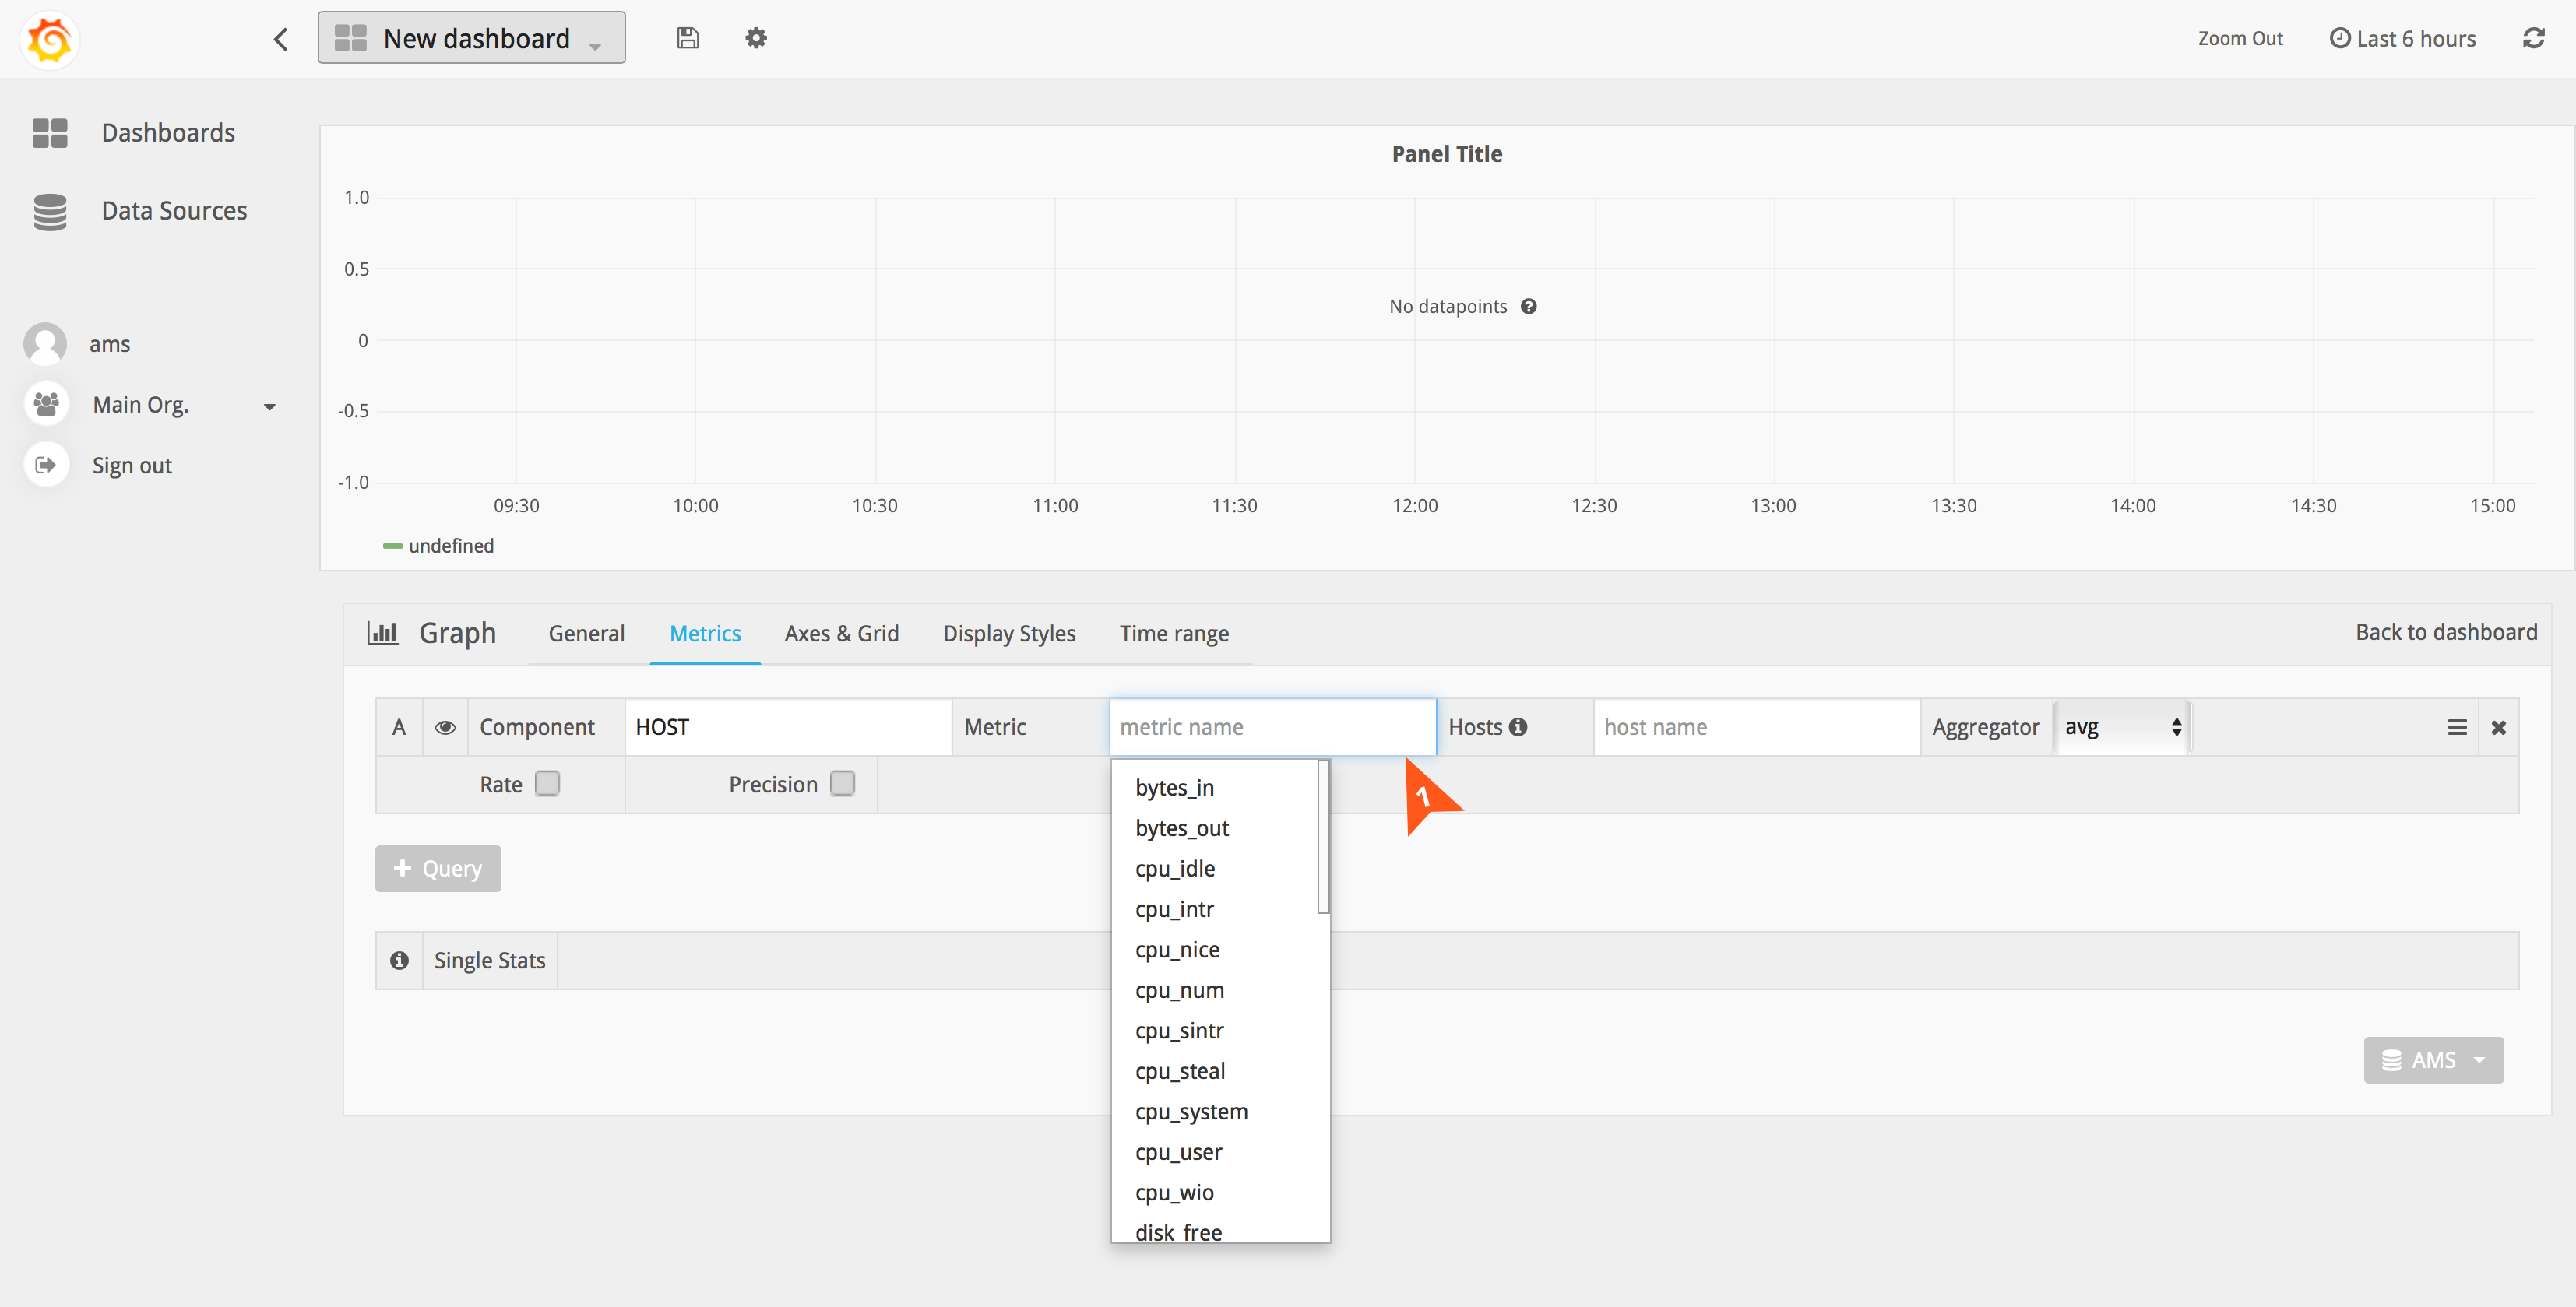
> - Choose hostname from the list of hosts if you wish to see metrics for a specific host.
> - if hostname isn't chosen, metrics will be shown on a service component level.

> - By default the aggregator is avg. You can change it via the dropdown
> - You can choose to enable Rate by selecting the checkbox.
> - You can specify precision by checking the box and then selecting "days, hours, minutes or seconds"

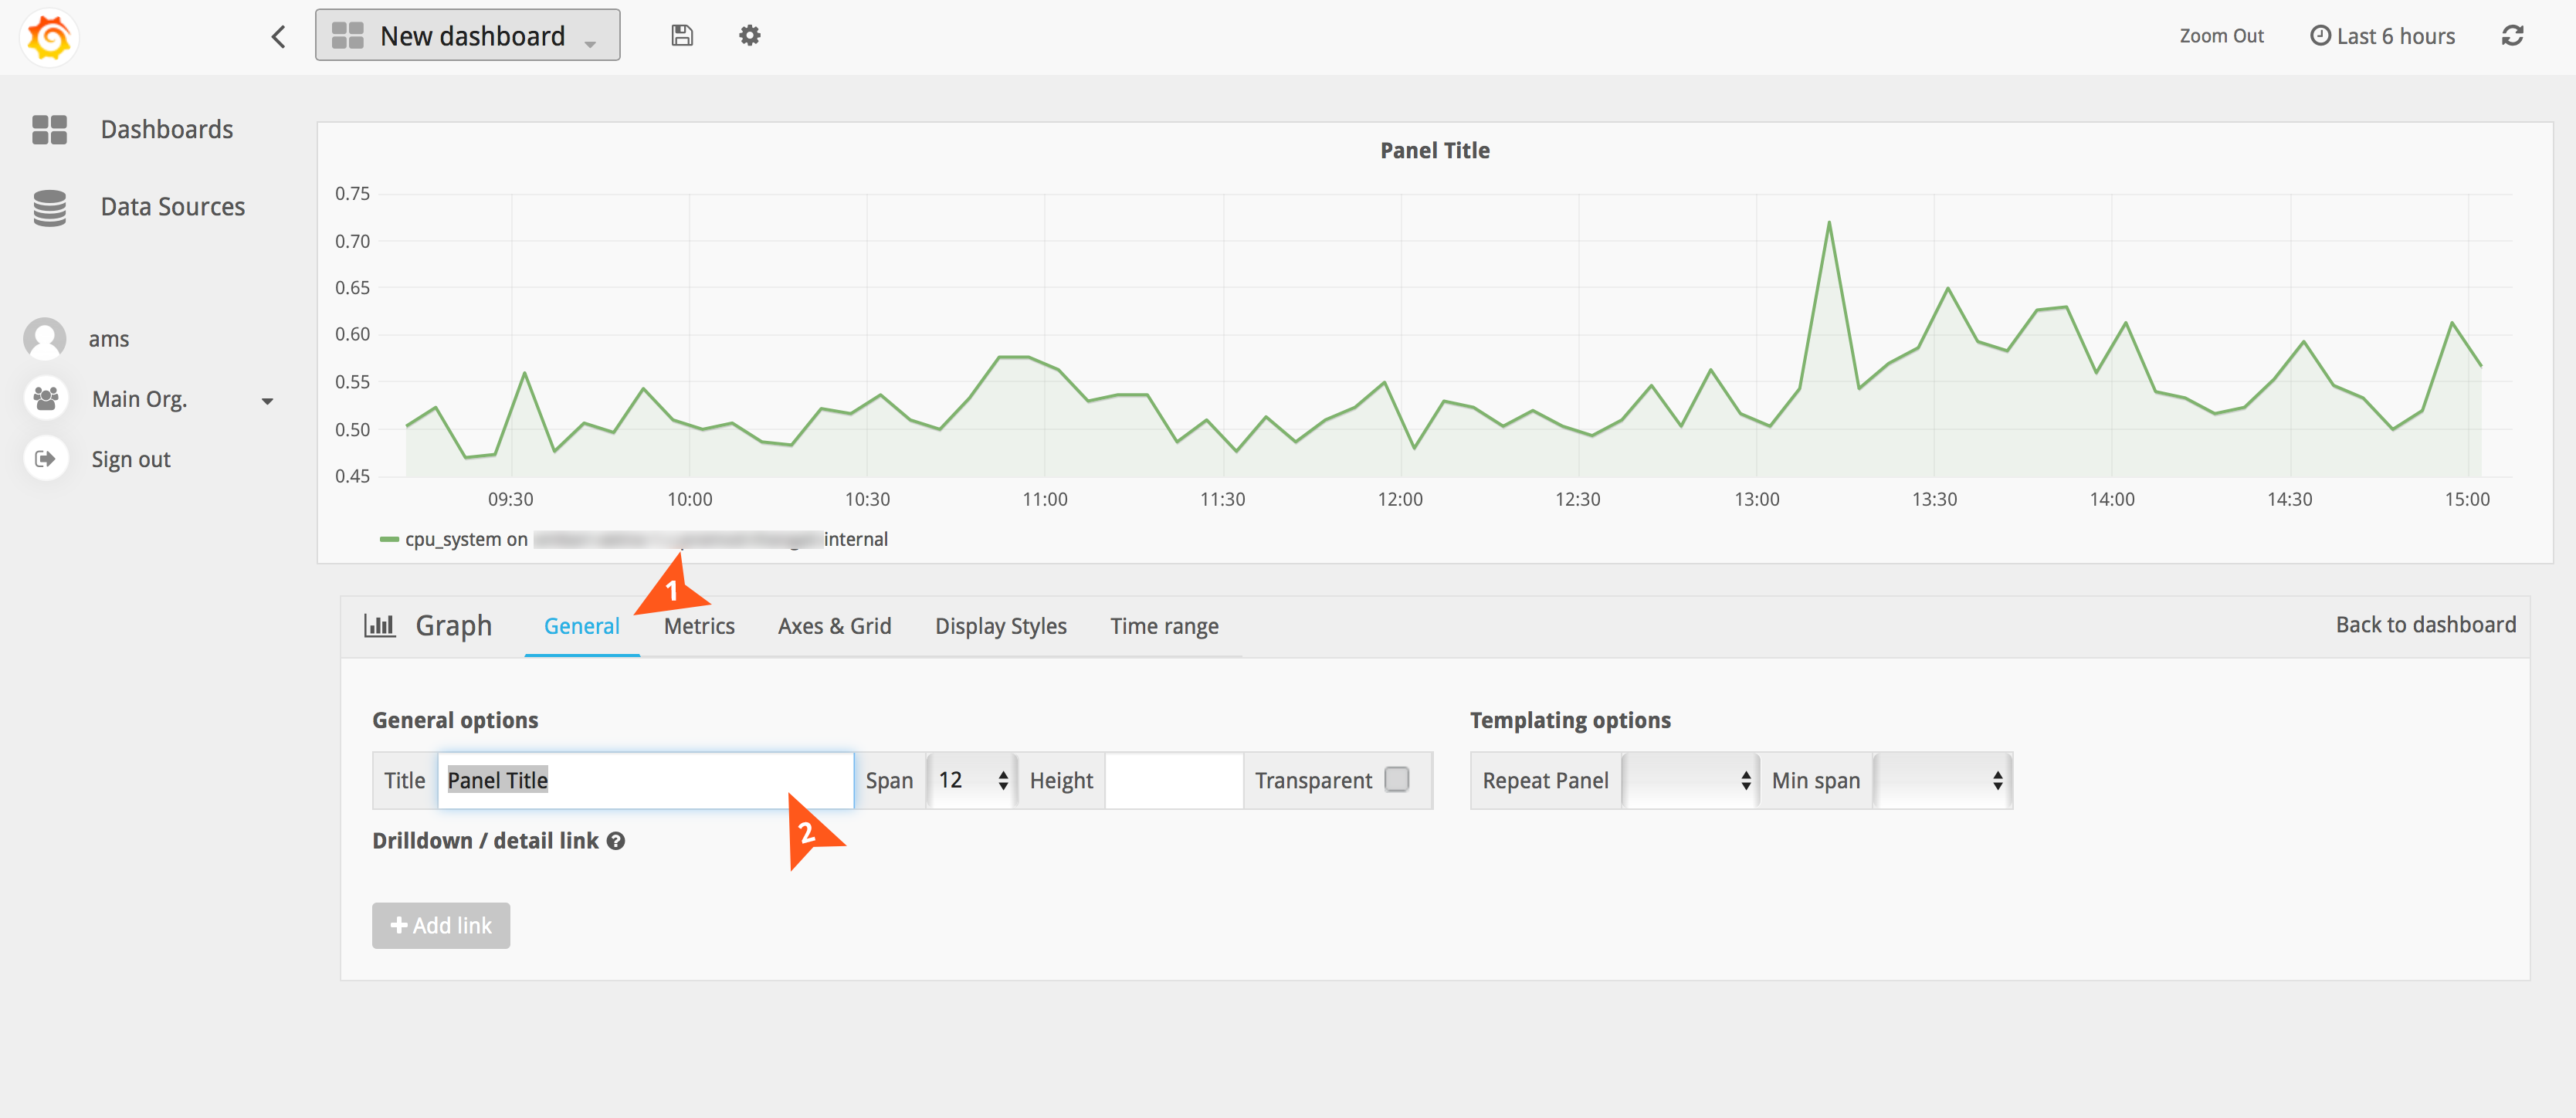
**To change the title of the Panel**
> - Click on the "General" tab
> - Enter the name to change the title of the panel
**To change the Units for your metric**
> - You can edit the units of your graph by clicking on **Axes & Grid** tab and clicking on "unit" as shown.

**To customise your graphs**
> - You can customise your graph by clicking on the **Display Styles** tab.
> - For ex: you can change the color of a specific metric by choosing a series specific override at the bottom.

**To Save the Dashboard**
> - Click on the save icon next to the dashboard list dropdown on the top to save your dashboard.

**To Edit a Graph**
> - Click on the title of your graph/panel and click on edit.

---
### Time Ranges
**To change the Time Range**
> - To change the timerange click on the top right of your UI.
> - This setting affects all your graphs inside the dashboard. If you wish to customise time for a specific graph [look here](#timeshift)
> - You can use the quick ranges provided or choose a time range of your choice. You can also choose a refresh duration for your dashboard or leave it at "off" to manually refresh.

**To change the time range of one graph only**
> - Use this in case you wish to change the time range for a specific graph without affecting the other graphs in your dashboard
> - Click on the **Time Range** tab of your Graph
> - You can then enter a value in the "Override Relative time" input box
> - You will be able to confirm that this change has occured by looking at the top right of your graph which will show the override message.
> - You can choose to hide this message if you wish to do so (by checking the "hide time override info")

---
### Templating
**Templating allows you to dynamically change graphs by selecting your host from dropdown. To created a templated dashboard, you can follow these steps.**
> 1. Click on the "cog" on the top, select "Templating"
> 2. Click on "+ New"
> 3. Enter a name for your variable. Ex: "hosts".
> 4. Type: query
> 5. Datasource: This should be set to the name you had chosen for your Datasource. Default is "AMBARI_METRICS"
> 6. Query: This needs to be "hosts". It is case sensitive as well.
> 7. Once you've entered the query and you focus your cursor anywhere else, you should see the "Preview of values" updated with the hostnames in your cluster.
> 8. You can close the Templating Variables section.
> 9. You should now have a dropdown on your dashboard with hosts from your cluster.
> 10. When you now add a graph, and select your component and metric, the plotted graph will show you metrics for the selected hostname from the dropdown.
> 11. The legend on the graph will also now update with the selected host.
**Templated dashboards do support multiple metrics in a single graph.**

---
### Multi Host Templated Dashboards.
**Templated dashboards now have the ability to filter graphs based on a single host or multiple hosts.**
> 1. Once you've created your templated dashboard, you can edit it gain by clicking on the "cog" on the top, select "Templating".
> 2. Click on "Edit" for your templating variable.
> 3. To be able to select Multiiple Hosts, set multi-value selection to "enable" and leave multi-format set to "glob".
> 4. To have an option for All hosts, select All Value, and set it to "*" and All format to "wildcard".
> 5. Hit Update and close the templating variables options and you should be now able to select multiple hosts from the dropdown (or "all" hosts at once.)
